

Setting Dashboards
Throughout this exercise, we have been working with NGINX logs. DataSet handles these logs well and has built-in support. If you assign the parser to the built-in parser, in this case `accessLog` and map the serverHost value to the name or id of your machine.
If you are bringing logs from a custom app, then create the parser yourself or ask us to build it for you
Assuming you are parsing the logs properly and have the serverHost assigned, then you can navigate to the webServer Dashboard, select the filebeat server from the dropdown and begin to utilize it.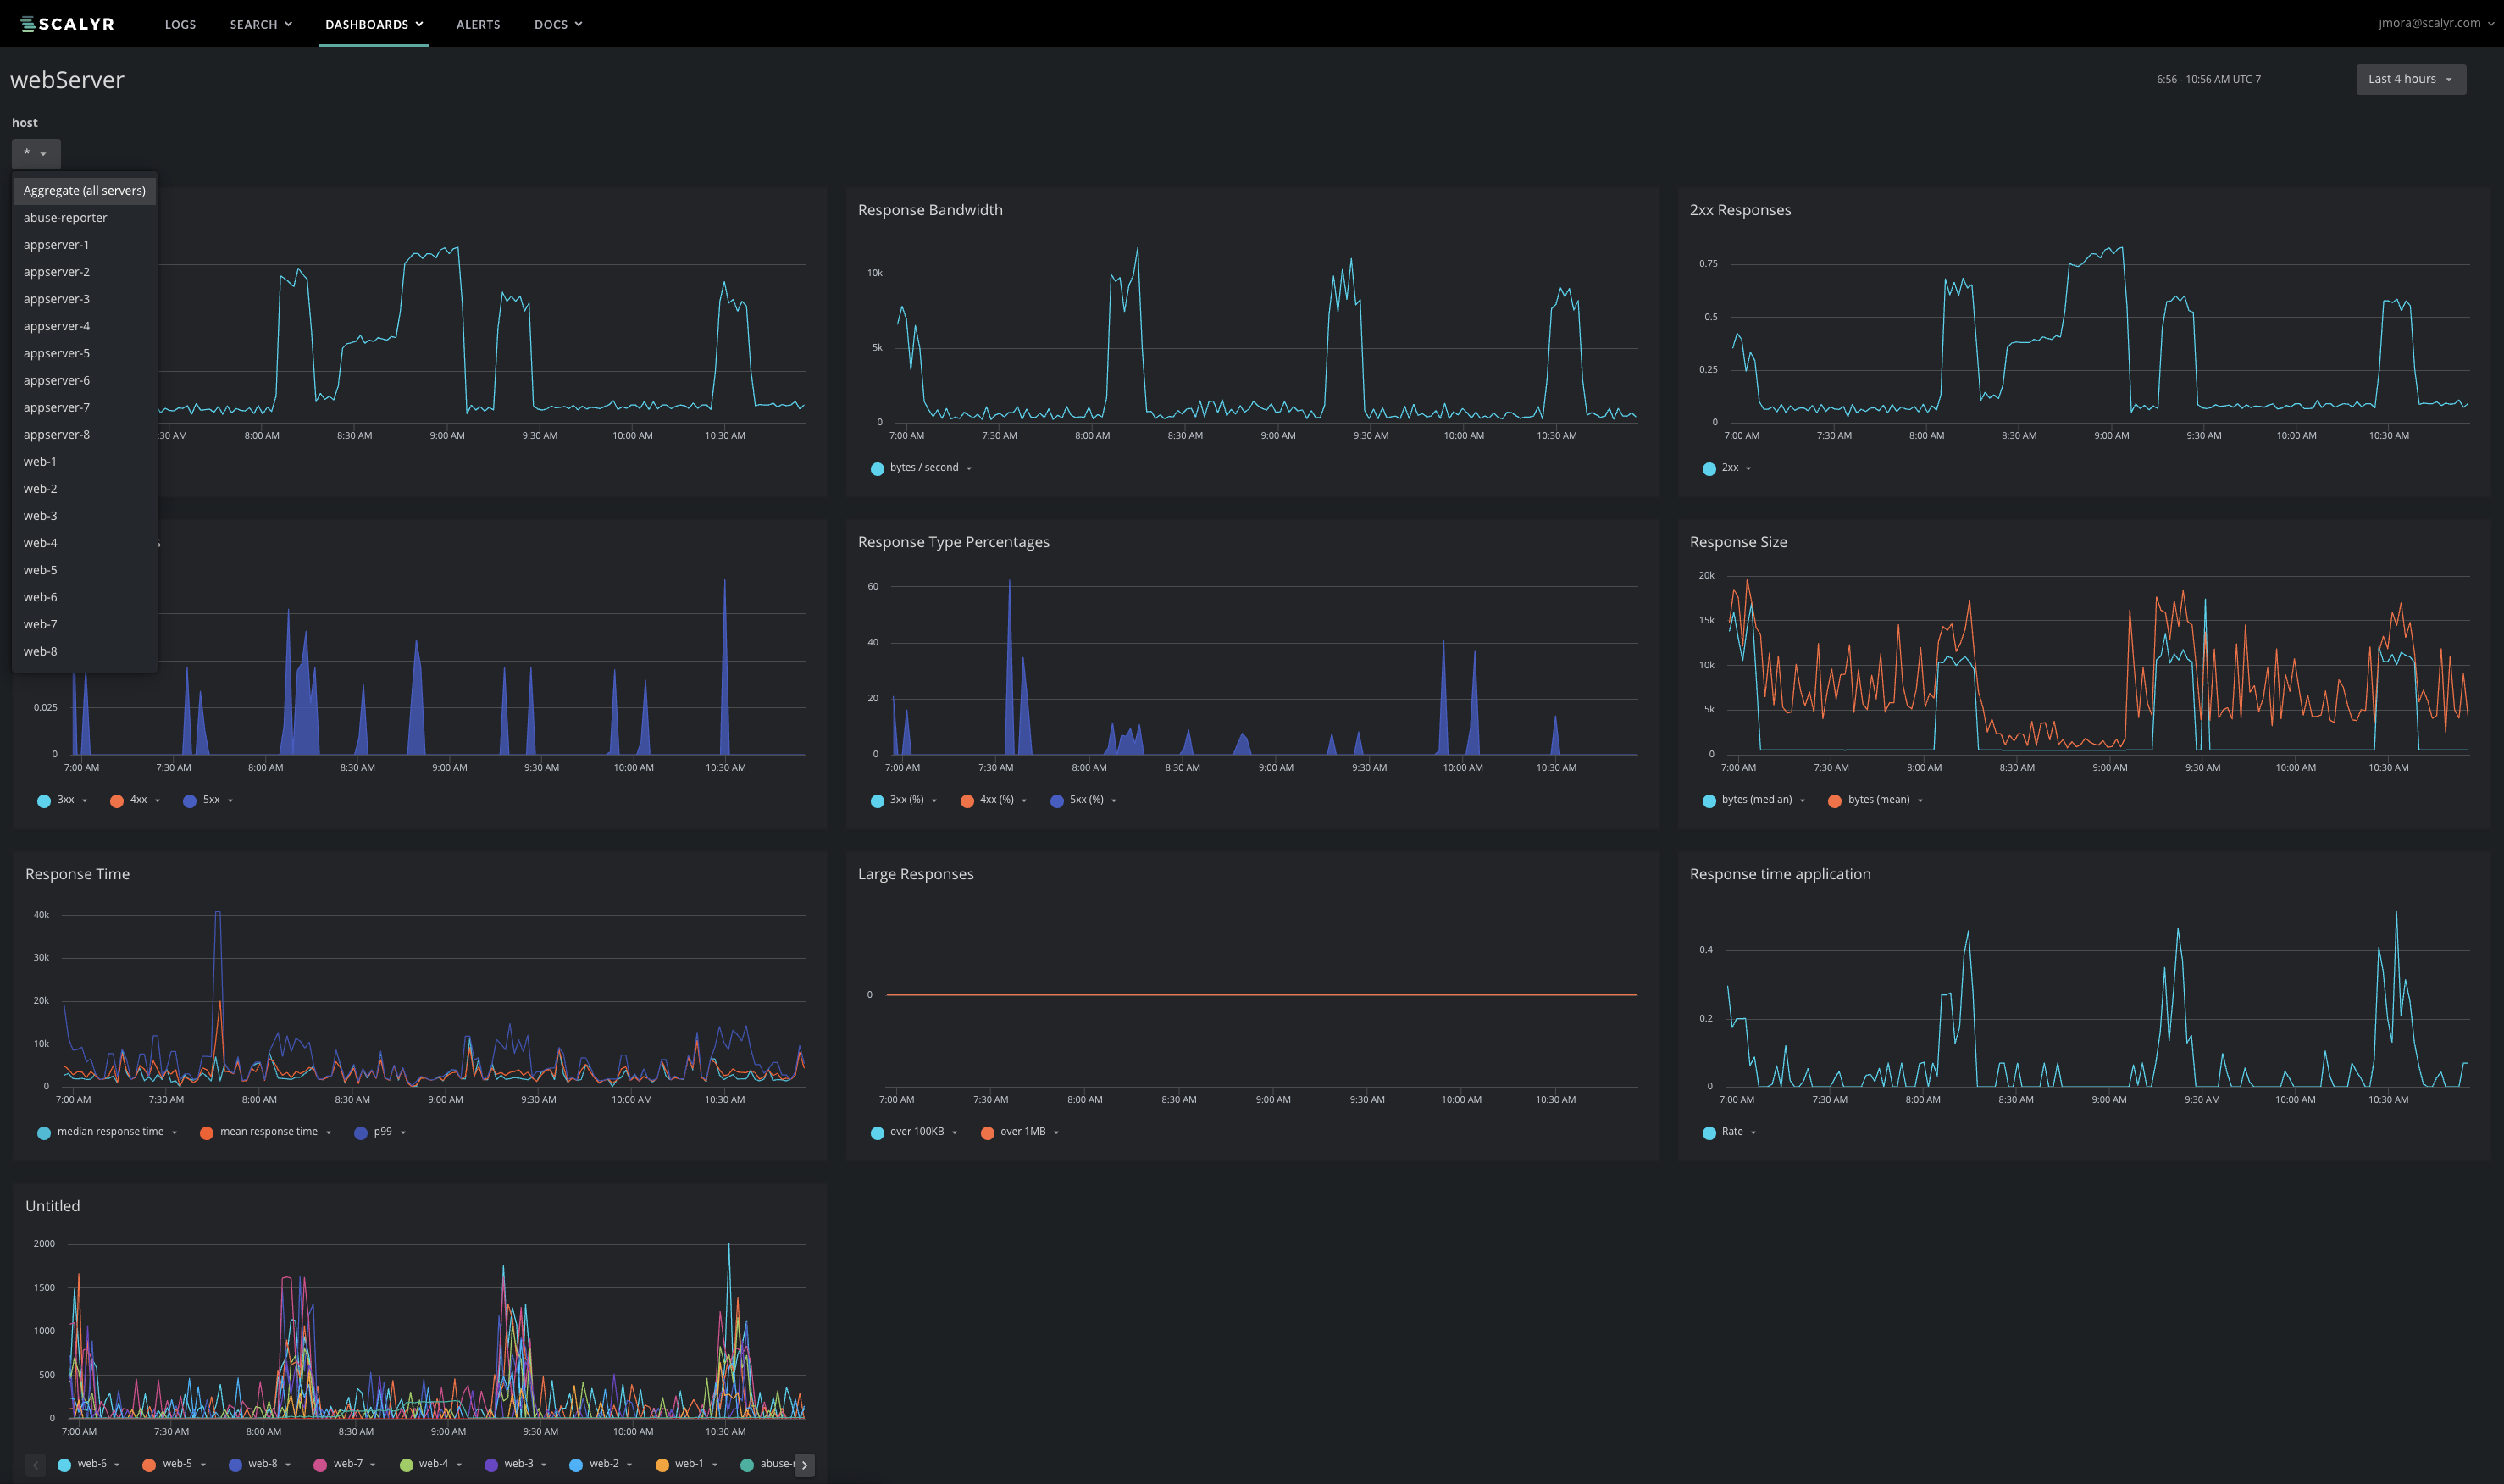
The following alerts can also go with this webserver dashboard. You can read about how to set alerts here.
Slow response time
 {
     alertAddress: "demo-kafka@scalyr.com",
     description: "Delays over 7.5s",
     renotifyPeriodMinutes: 60,
     resolutionDelayMinutes: 5,
     trigger: "count:2 minutes(timeMs > 7500) > 0",
     gracePeriodMinutes: ""
},
High Bandwidth
{
     alertAddress: "demo-kafka@scalyr.com",
     description: "Delays over .5s",
     renotifyPeriodMinutes: 60,
     resolutionDelayMinutes: 5,
     trigger: "sumPerSecond:1 minutes(bytes where $dataset=\"accesslog\") > <threshold>",
     gracePeriodMinutes: 0
},
Bandwidth compared to last week up 50%
{
alertAddress: "demo-kafka@scalyr.com",
description: "Delays over .5s",
renotifyPeriodMinutes: 60,
resolutionDelayMinutes: 5,
trigger: "mean:1hour(bytes where $dataset=\"accesslog\")/mean:1hour:7d(bytes where $dataset=\"accesslog\") > .5",
gracePeriodMinutes: 0
},
Errors
{
alertAddress: "demo-kafka@scalyr.com",
description: "Delays over .5s",
renotifyPeriodMinutes: 60,
resolutionDelayMinutes: 5,
trigger: "mean:1hour(status >= 500 $dataset=\"accesslog\")/mean:1hour:7d(status >= 500 $dataset=\"accesslog\") > .5",
gracePeriodMinutes: 0
},
Comments
0 comments
Please sign in to leave a comment.