

Introduction
DataSet has a default "log Volume" dashboard that displays log volume by host and K8s cluster (if applicable).
https://app.scalyr.com/dash?page=log+Volume
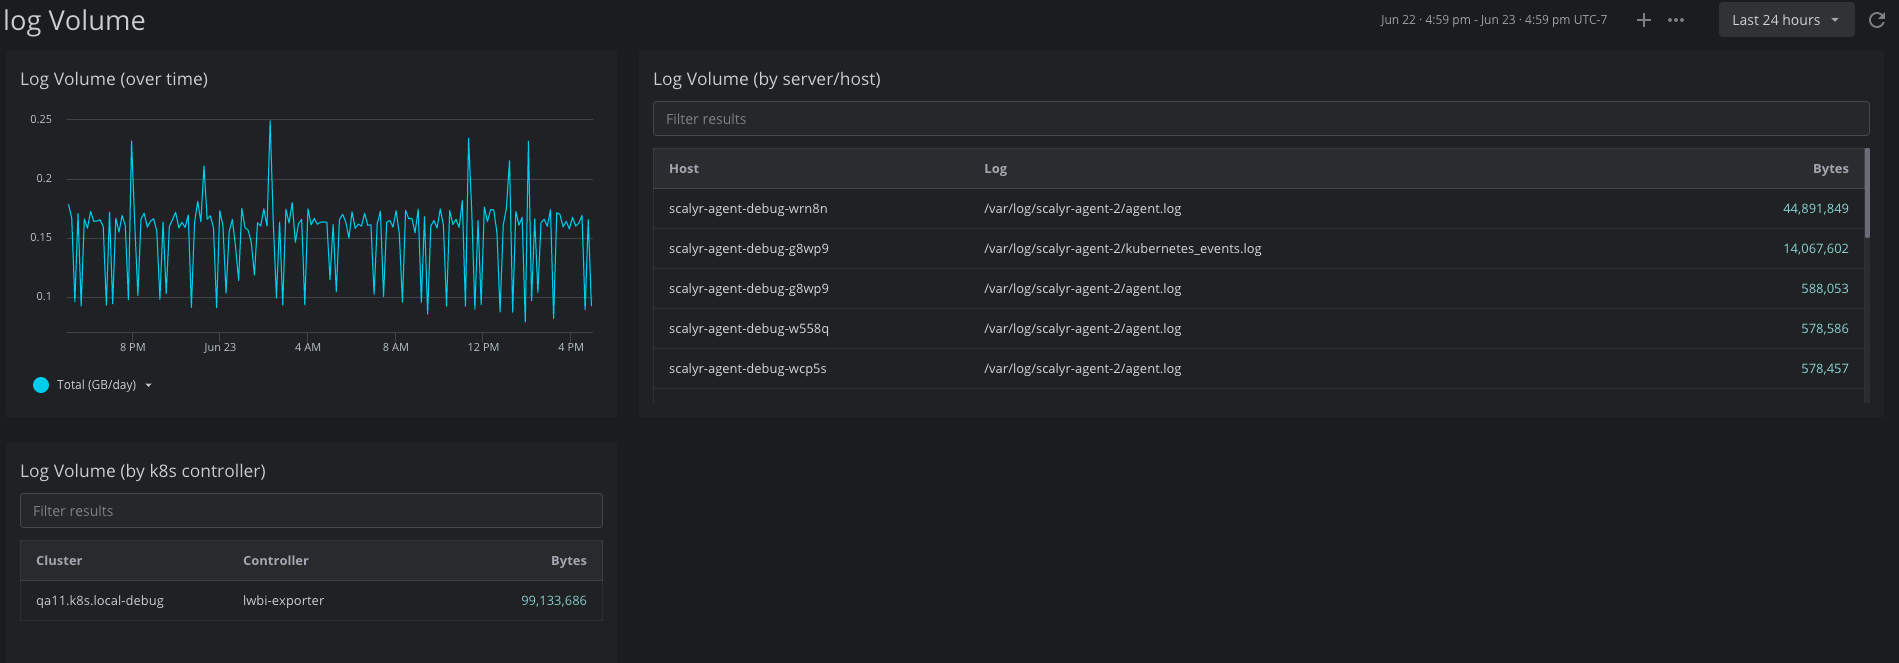
This is convenient for monitoring ongoing log volume. However, as log volume increases, a more specific solution may be needed.
DataSet PowerQueries enable customers to apply the power of SQL to dissimilar yet highly informative platform logs. In this example, we'll be using a JOIN to link two otherwise unrelated logs. This will enable us to evaluate the serverIP and host values relative to where the log volume originated. Please note that this example was designed to showcase how to use PowerQueries for spot analysis. You may wish to modify it to suit your specific requirements.
For example, if I want to break down log volume by the serverIP on each host. I can use the following query:
| join
vol = (
tag = "logVolume" metric='logBytes'
| group MB = sum(value)/1024/1024 by host = host ? host : k8s-deployment
),
ips = (
serverIP=*
| group c=count() by serverIP, host = serverHost
)
on host
| group mb = sum(MB) by serverIP, host
| sort -mb
Caution: this method assumes that each value of serverHost and/or k8s-deployment maps to exactly one value of the custom field. In this example, to confirm that this many-to-one relationship exists between serverHost and serverIP, I can run this query:
serverIP=*
| group uniques = estimate_distinct(serverIP) by serverHost
| filter uniques > 1
If this query returns any values, then the join query above will not produce reliable results.
Comments
0 comments
Please sign in to leave a comment.