

OpenTelemetry is a vendor-agnostic solution to generate, collect and export traces, metrics, and logs. The contributions to the open-source project that develops solutions for collecting telemetry data have been active in recent months to accommodate full observability for software made with dozens of services.
DataSet platform isn't compatible with telemetry data yet, but it's something that we'd like to contribute to the OpenTelemetry community in the near future. Today, I am going to share a few tips for sending both traces and logs to Scalyr for OpenTelemetry application developers.
1) Using OpenTelemtry Collectors
If your applications are already instrumented with OpenTelemetry using collectors, then getting data into DataSet requires very small configuration changes. All you need to do is to set the collector to receive telemetry data via OTLP and export it to a file, and the Scalyr Agent can scan the JSON messages from the file directly. Since the collector is an independent process, this is probably the easiest solution to ingest text-formatted telemetry data to DataSet with no additional changes to your existing instrumentation.
The following snippet is a manually instrumented python application that uses an OTLP exporter to log telemetry events (i.e "event message", new message and "another message").
....
....
otlp_exporter = OTLPSpanExporter(endpoint="localhost:55680", insecure=True)
span_processor = BatchSpanProcessor(otlp_exporter)
trace.get_tracer_provider().add_span_processor(span_processor)

with tracer.start_as_current_span('outer_span') as span:
    span.set_attribute("foo", "bar")

    # add an event
    span.add_event("event message", {"digits": 345})
    span.add_event("new message")

    with tracer.start_as_current_span('outer_span') as span:
        span.add_event("another message")
I can edit the OTEL collector config file to accept OpenTelemetry formatted data via GRPC protocol and write the data to a file with Protobuf JSON encoding (ex. testdata/basic.json).
receivers:
  otlp:
    protocols:
      grpc:

processors:
  batch:

exporters:
  file:
    path: testdata/basic.json
  logging:
    loglevel: debug

service:
  pipelines:
    traces:
      receivers: [otlp]
      exporters: [logging, file]
      processors: [batch]
    logs:
      processors: [batch]
      exporters: [logging, file]
Running the code generates a single trace to the file "basic.json" and the trace can be forwarded to DataSet via the agent. Note that the file exporter logs one event for every trace, so the workflow to troubleshoot is to search for the event to get the traceId or vice versa on DataSet.
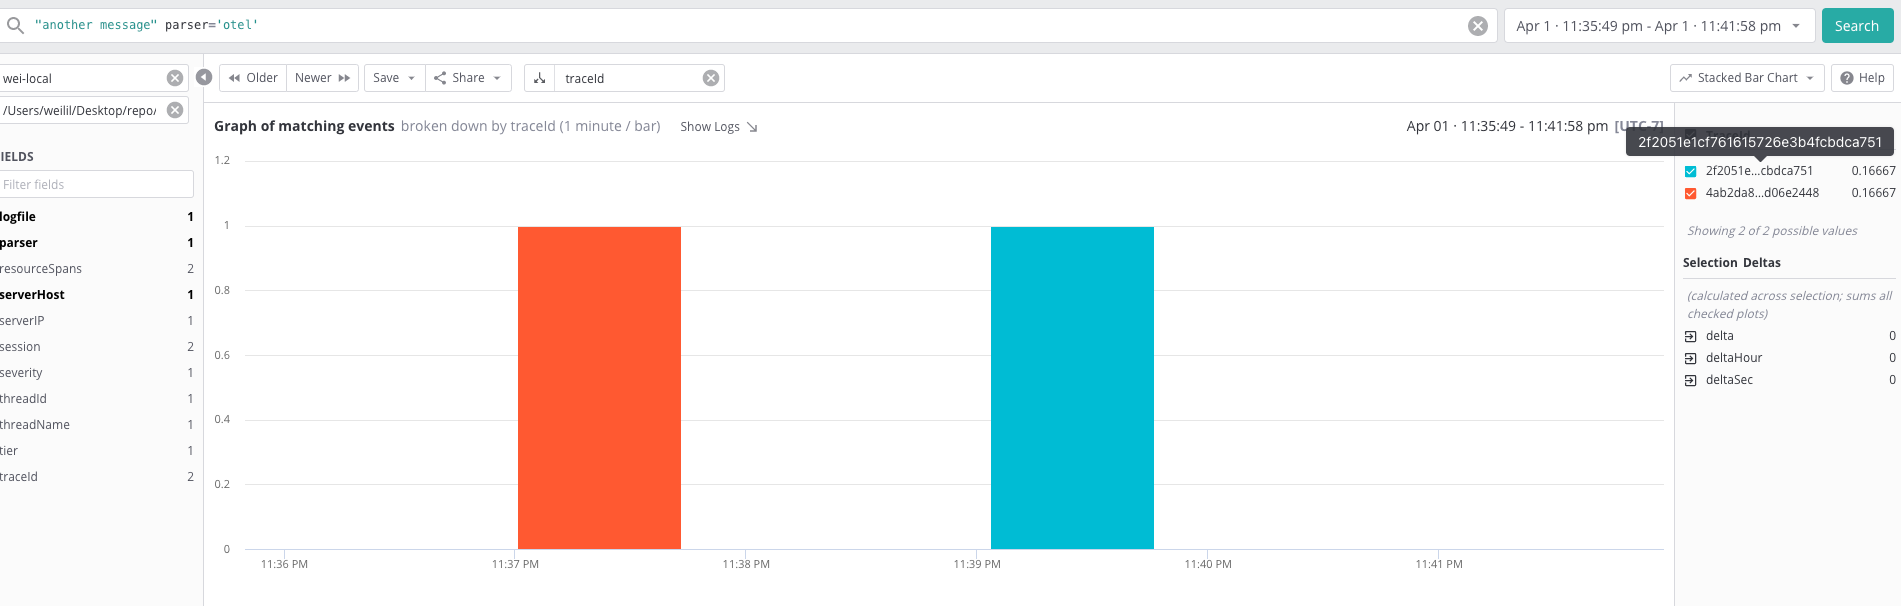
Submit a query "another message" to get the event's traceID
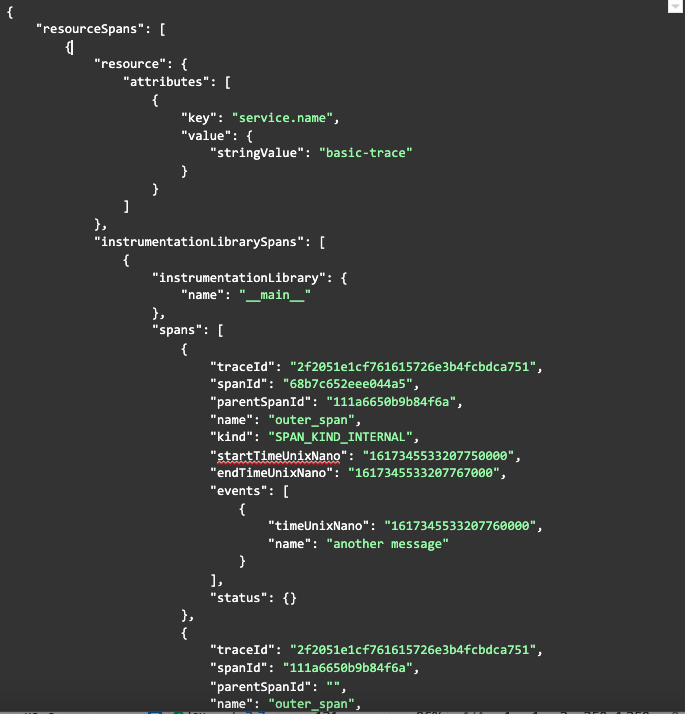
Raw trace log
2) Ingesting Span Outputs
The file exporter creates one log record per trace. When your application runs on tons of services, putting all spans and events into a single line isn't a great idea. One workaround is to replace the OTLP exporter with a console exporter in your instrumentation (I use python as an example in this article, but developers should have no problem finding a similar option in other languages).
A console exporter simply prints the trace data to stdout, so it's very similar to the collector's file exporter. The main difference is that the console exporter prints the data in JSON format per span rather than per trace, so it's much easier to read if the application consists of a large number of services.
Console exporter is very simple to use. All you need to do is to import the module and add it to the span processor.
from opentelemetry.sdk.trace.export import ConsoleSpanExporter, SimpleExportSpanProcessor
trace.get_tracer_provider().add_span_processor(SimpleExportSpanProcessor(ConsoleSpanExporter())
Executing the program generates spans info to the console first, and then the Scalyr Agent scans the output and sends it to DataSet. This approach is great for users on a distributed tracing platform like Lightstep, and they are looking for a complementary logging solution. You can easily build a Lightstep workflow link and navigate to DataSet to find corresponding events.
For instance, below is a sample workflow link definition that redirects from Lightstep to DataSet by matching the service name and operation, given that trace output is correctly parsed in DataSet.
https://app.scalyr.com/events?filter=$resourceService\.name == "{{$service}}"
  $name == "{{$operation}}"&&endTime={{$endTimeMillis+5min}}&startTime={{$endTimeMillis-5min}}&mode=log
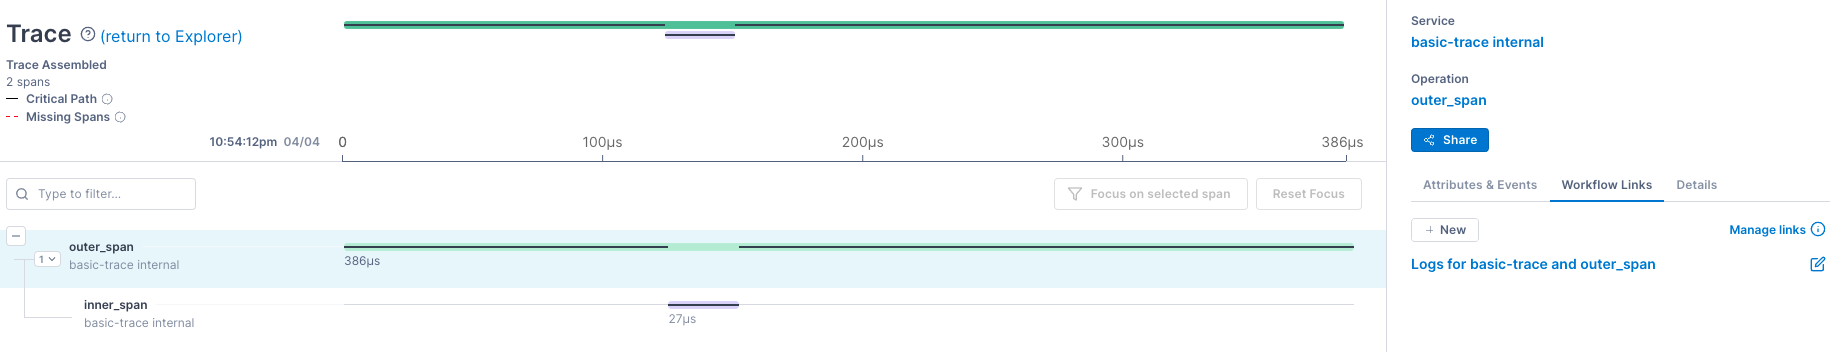
Click on workflow link from Lightstep trace view
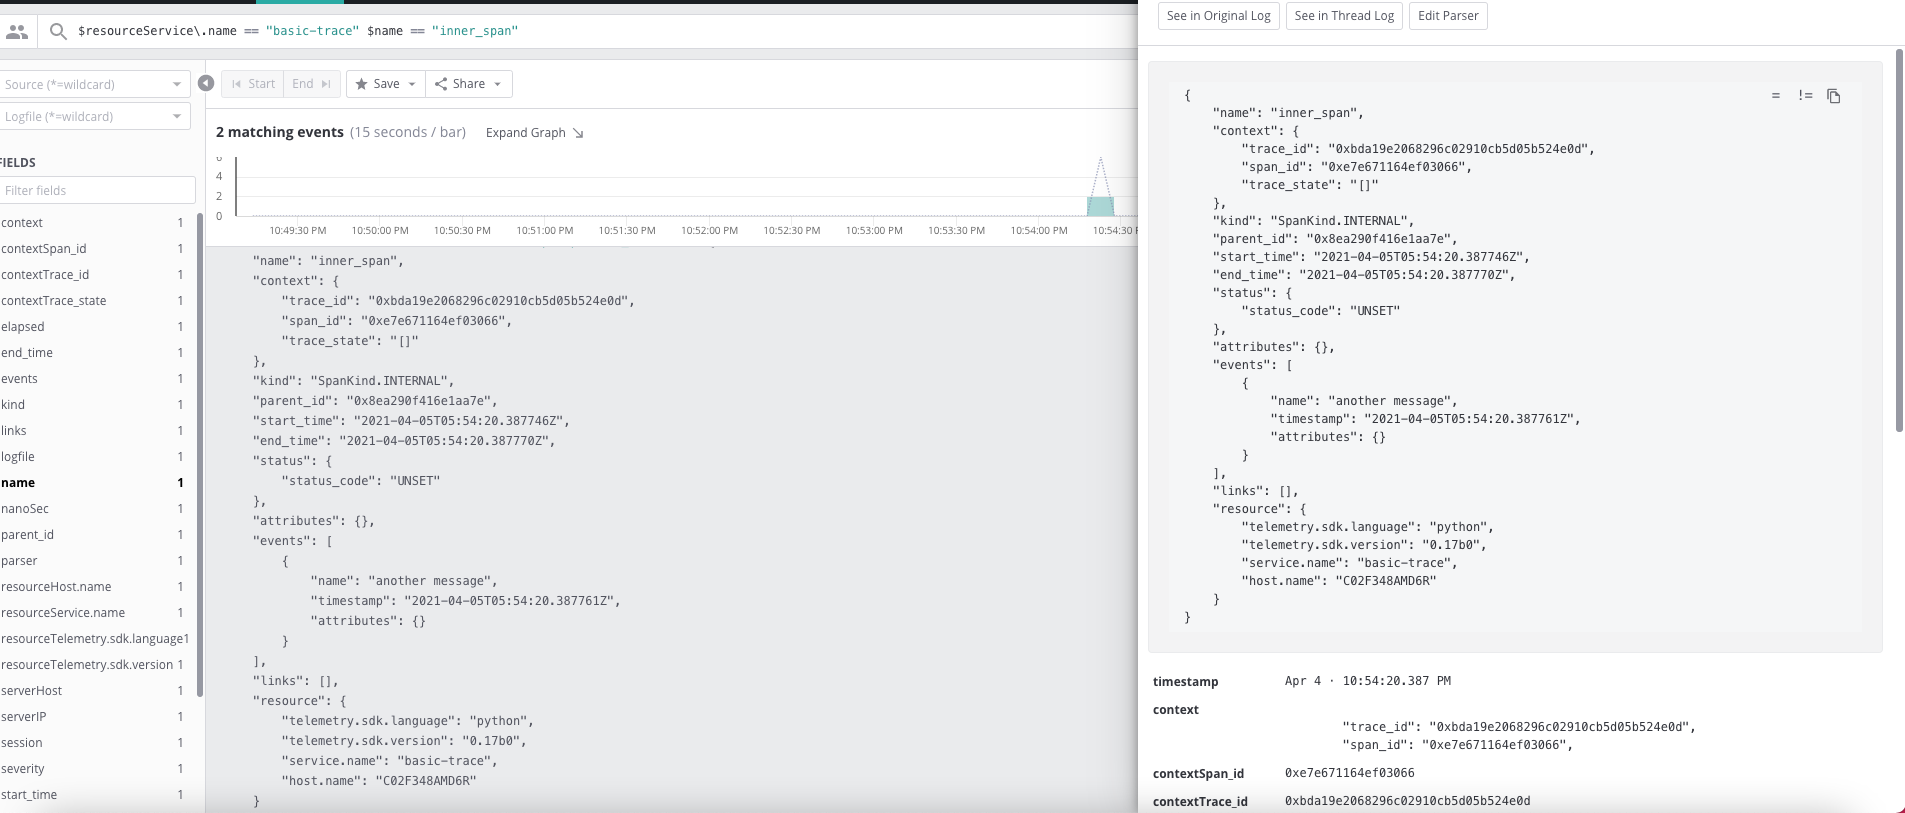
Get the span info on DataSet
3) Implementing a Function to Correlate Traces with Events
For users who have the option to modify the application implementation, they could implement a custom function to extract all of the metadata they need from the span first and then merge them into individual log records.
One span includes one or more events in OTEL instrumentation. In my prior sample code, I add two events: event message and new message to the span "outer span". Those two events are two independent messages that share the same traceId and spanId. With the following custom function "log_context", I can break the span into multiple log records and attach the span attributes to each record as a single message in DataSet.
def log_context(span):
    trace_id = str(hex(span.context.trace_id))[-16:]  # changes the id from binary to hex
    span_id = str(hex(span.context.span_id))[-16:]
    ops = span.name

    for e in span.events:
        timestamp = e.timestamp
        attr = e.attributes
        msg = e.name
        log_dict = {'timestamp': timestamp, 'trace_id': trace_id, 'span_id': span_id, 'attr': dict(attr), 'msg': msg, 'ops': ops}
        logger.info(json.dumps(log_dict))
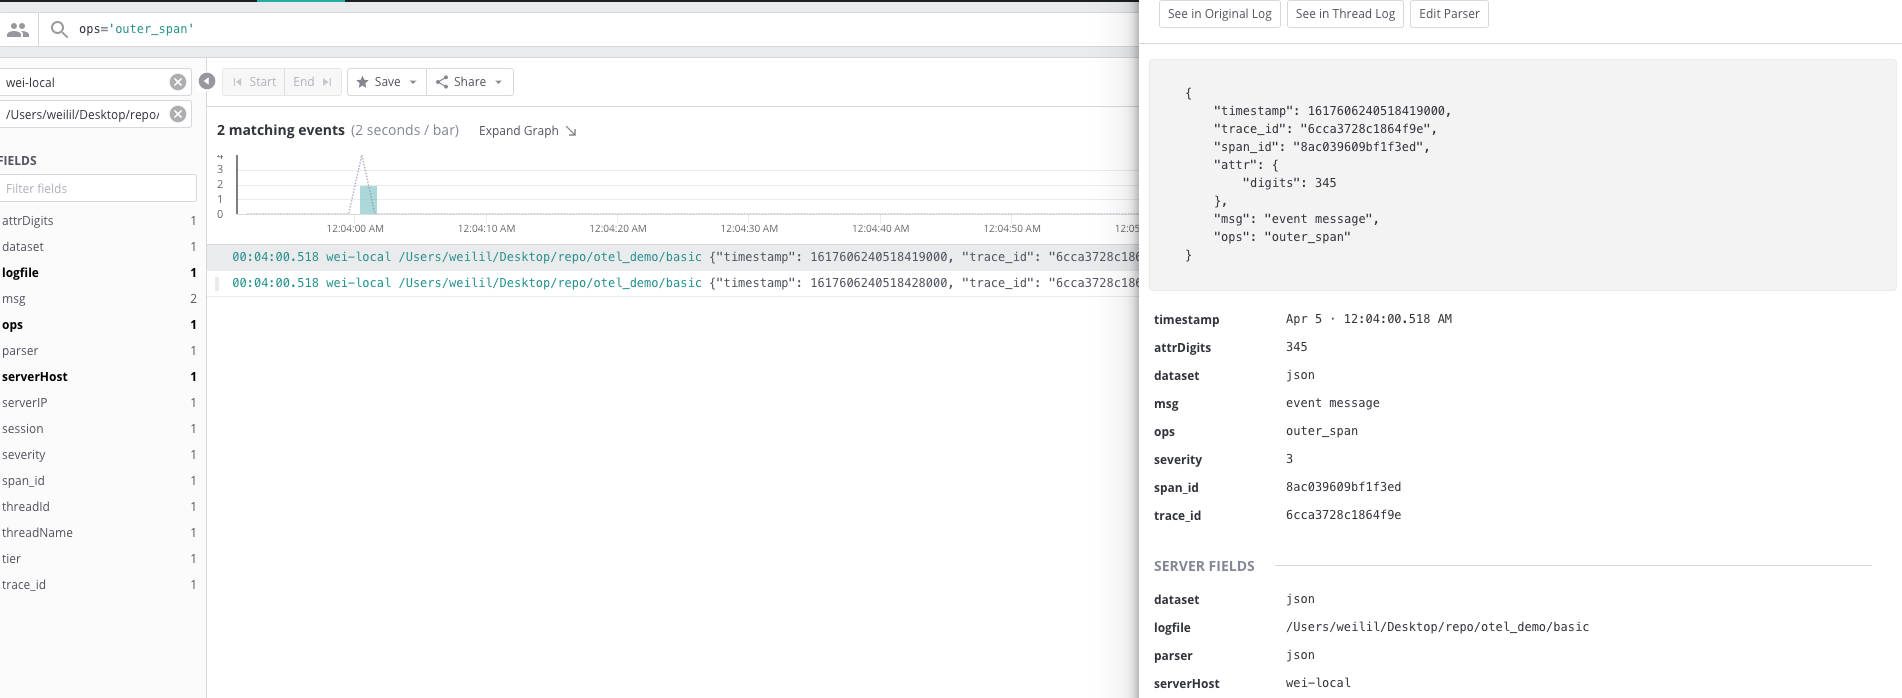
The formatted event with complete span info
Here are 3 basic interim solutions for users who need full observability and also require scalable logging service like DataSet. We'd love to hear your feedback, so please let us know if you are interested in learning more about DataSet's work in OpenTelemetry.
Comments
0 comments
Please sign in to leave a comment.