

Introduction
You can leverage Zscaler data with the power of DataSet by ingesting ZIA logs. You have two options to forward logs: You can do so with the API, or you can deploy an NSS server and a DataSet agent on that server.
Prerequisites
- SentinelOne customer with console and Marketplace access
- Zscaler customer with console and API access
- SCIM integration with an IDP
Setup Zscaler
Option A: Cloud to Cloud
Caution: This method cannot support ingestion of more than 10 GB/day
To set up RESTful forwarding to forward ZIA logs follow the instructions below:
- Log in and navigate to Administration > Cloud Configuration > Nano Streaming Service
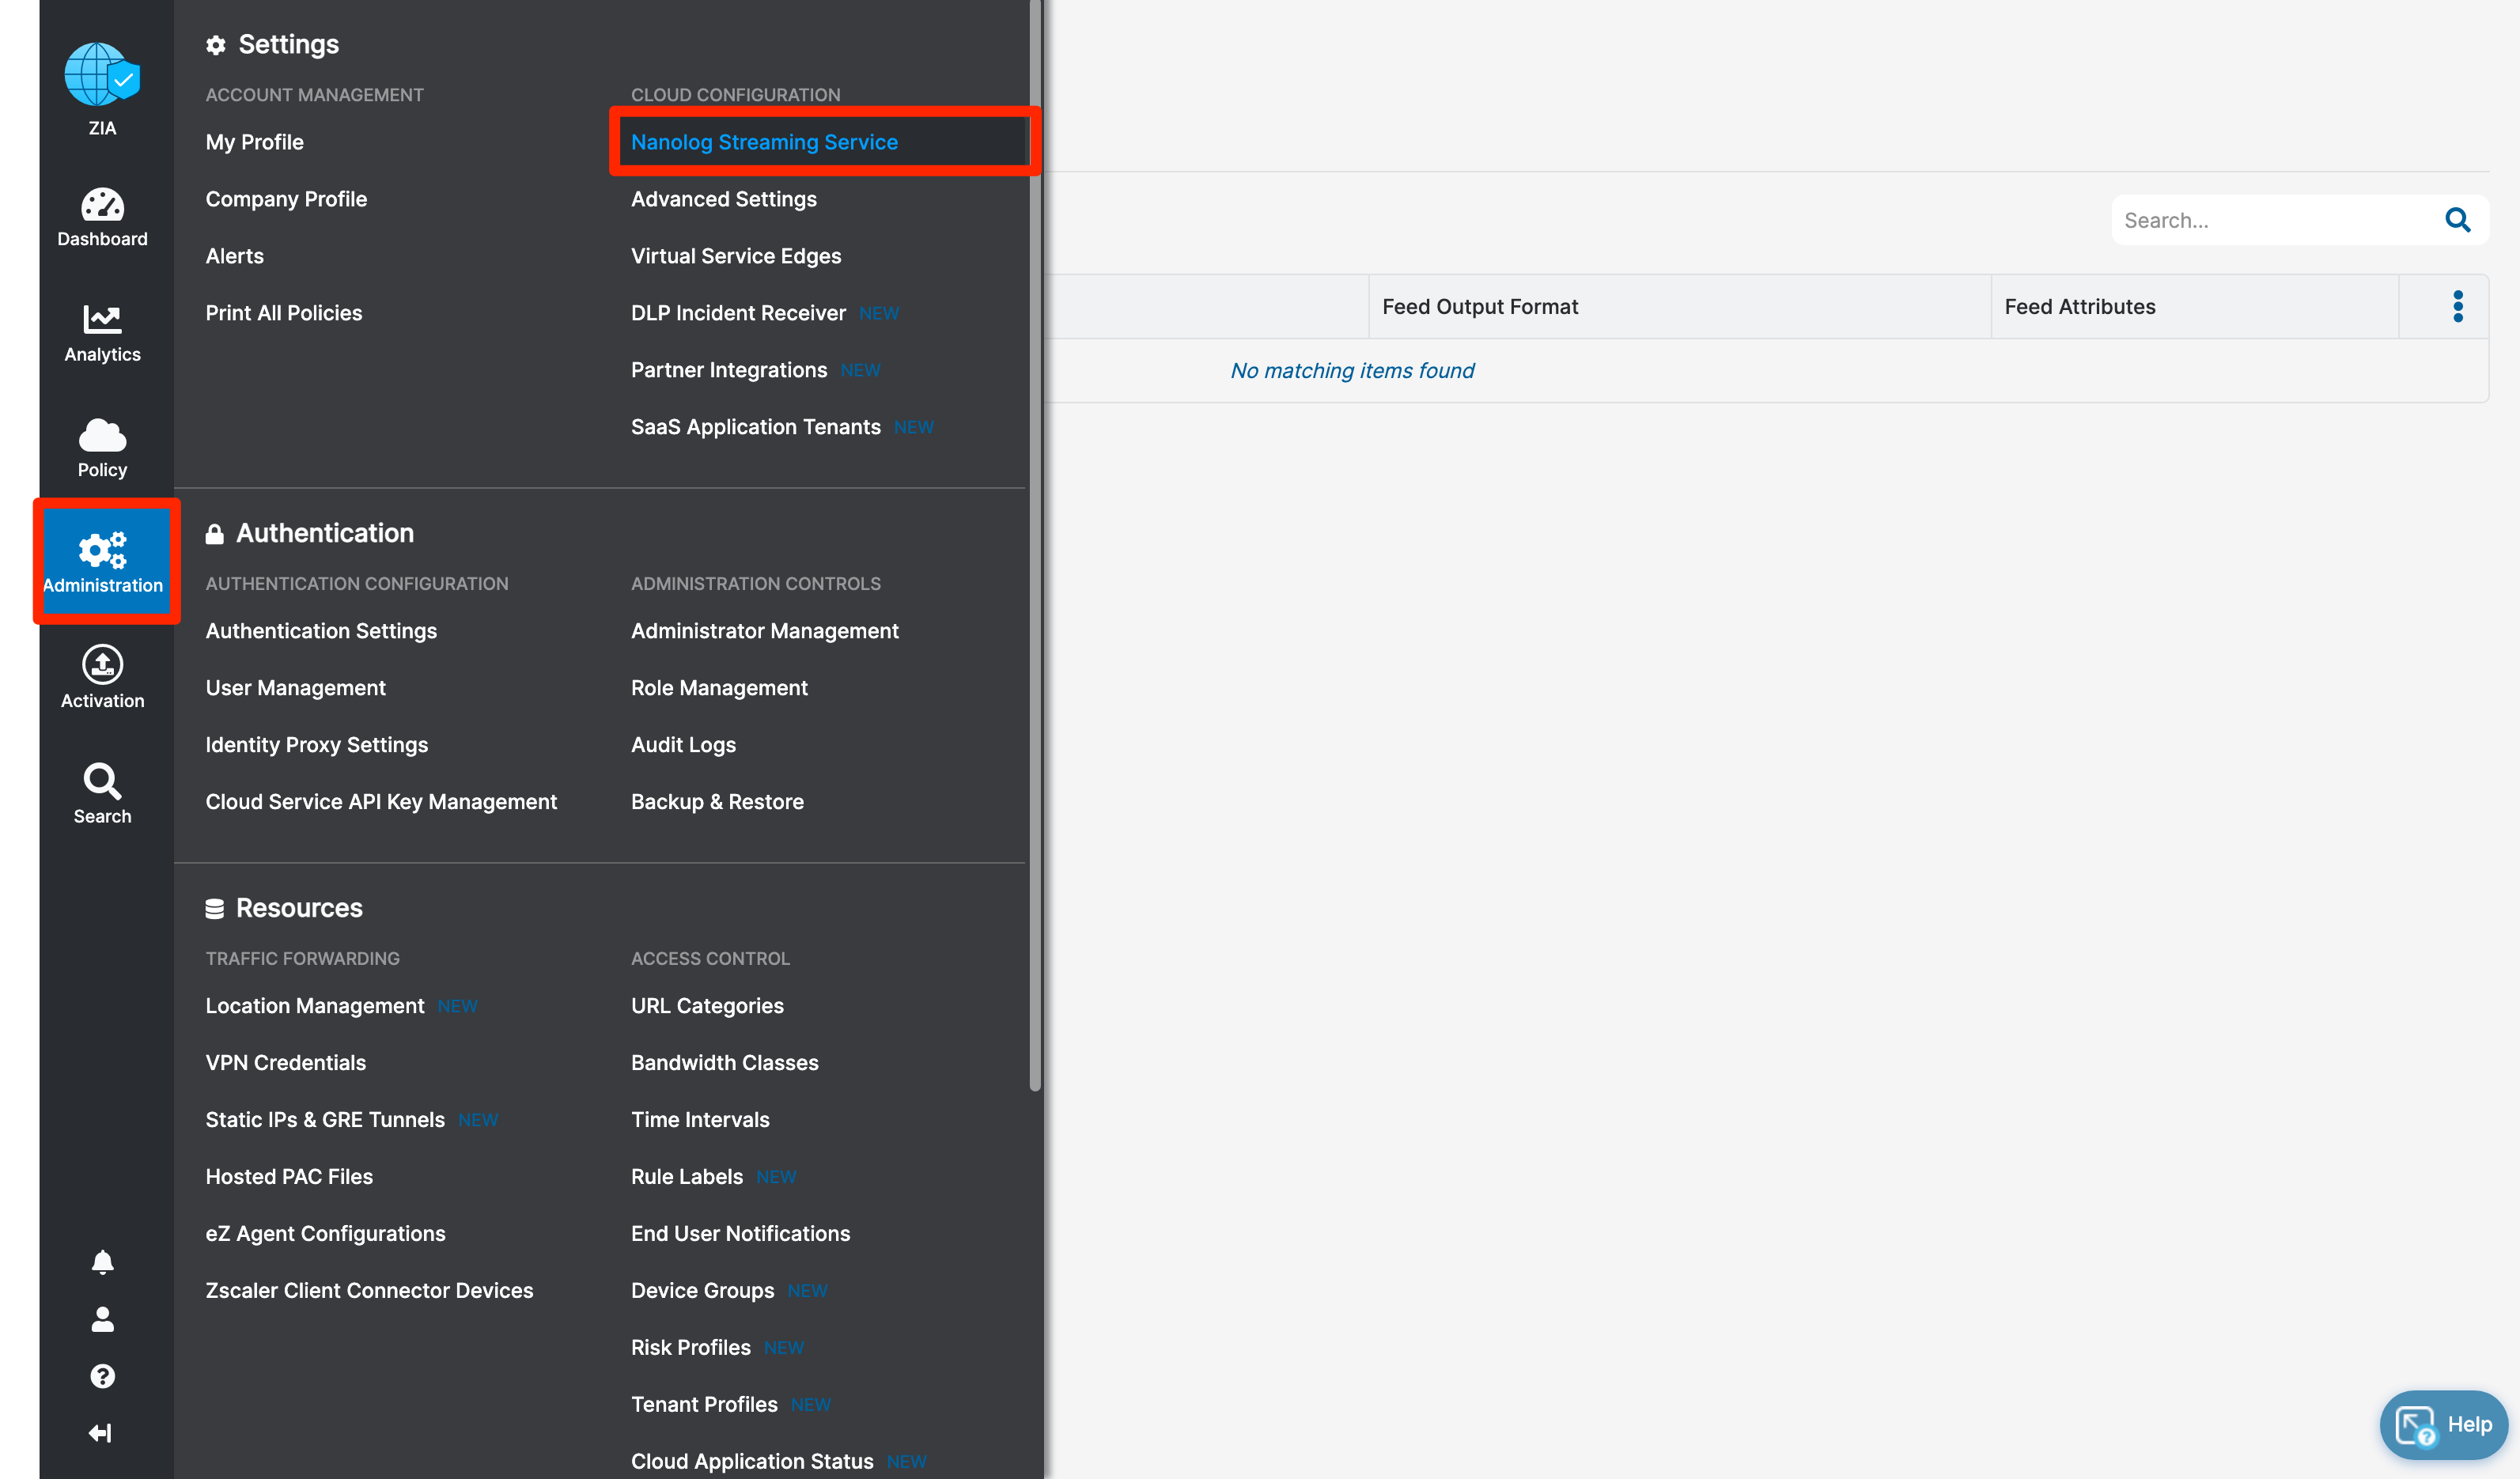
-
Add Cloud NNS Feed
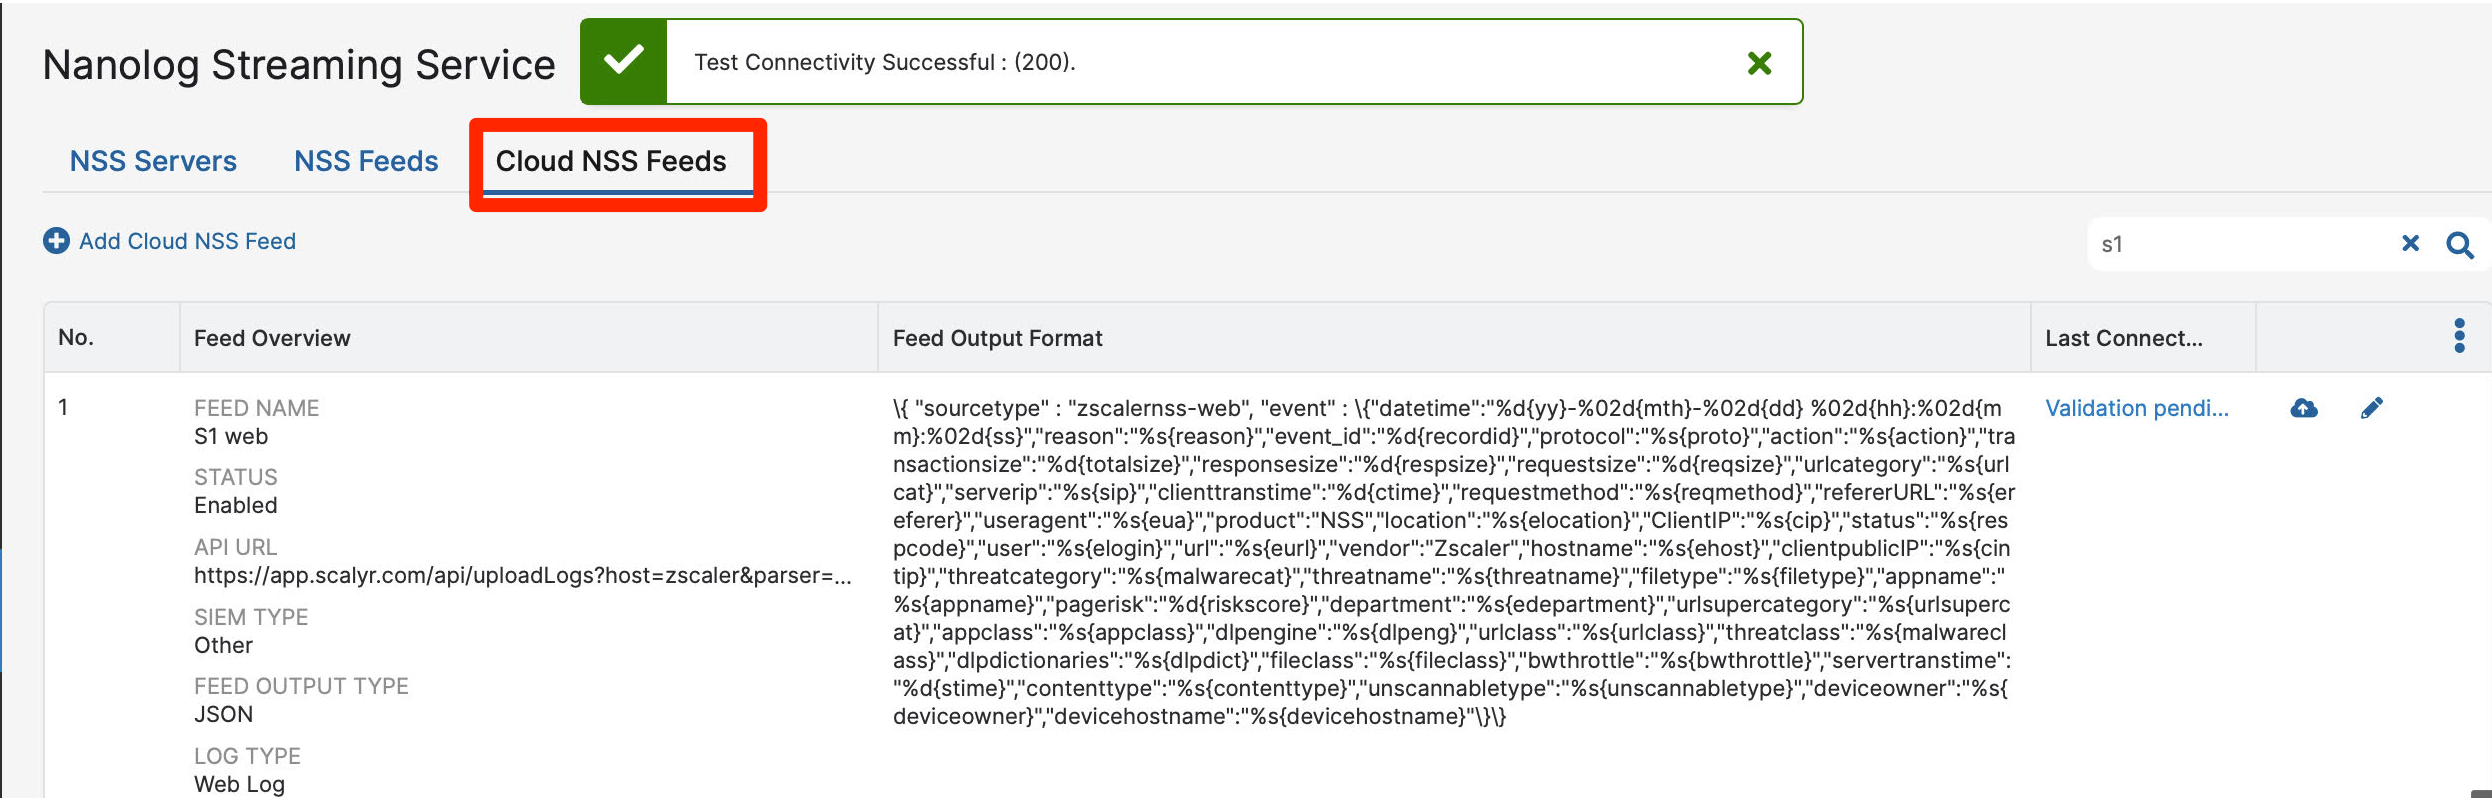
- Add new feed

- Configure the form
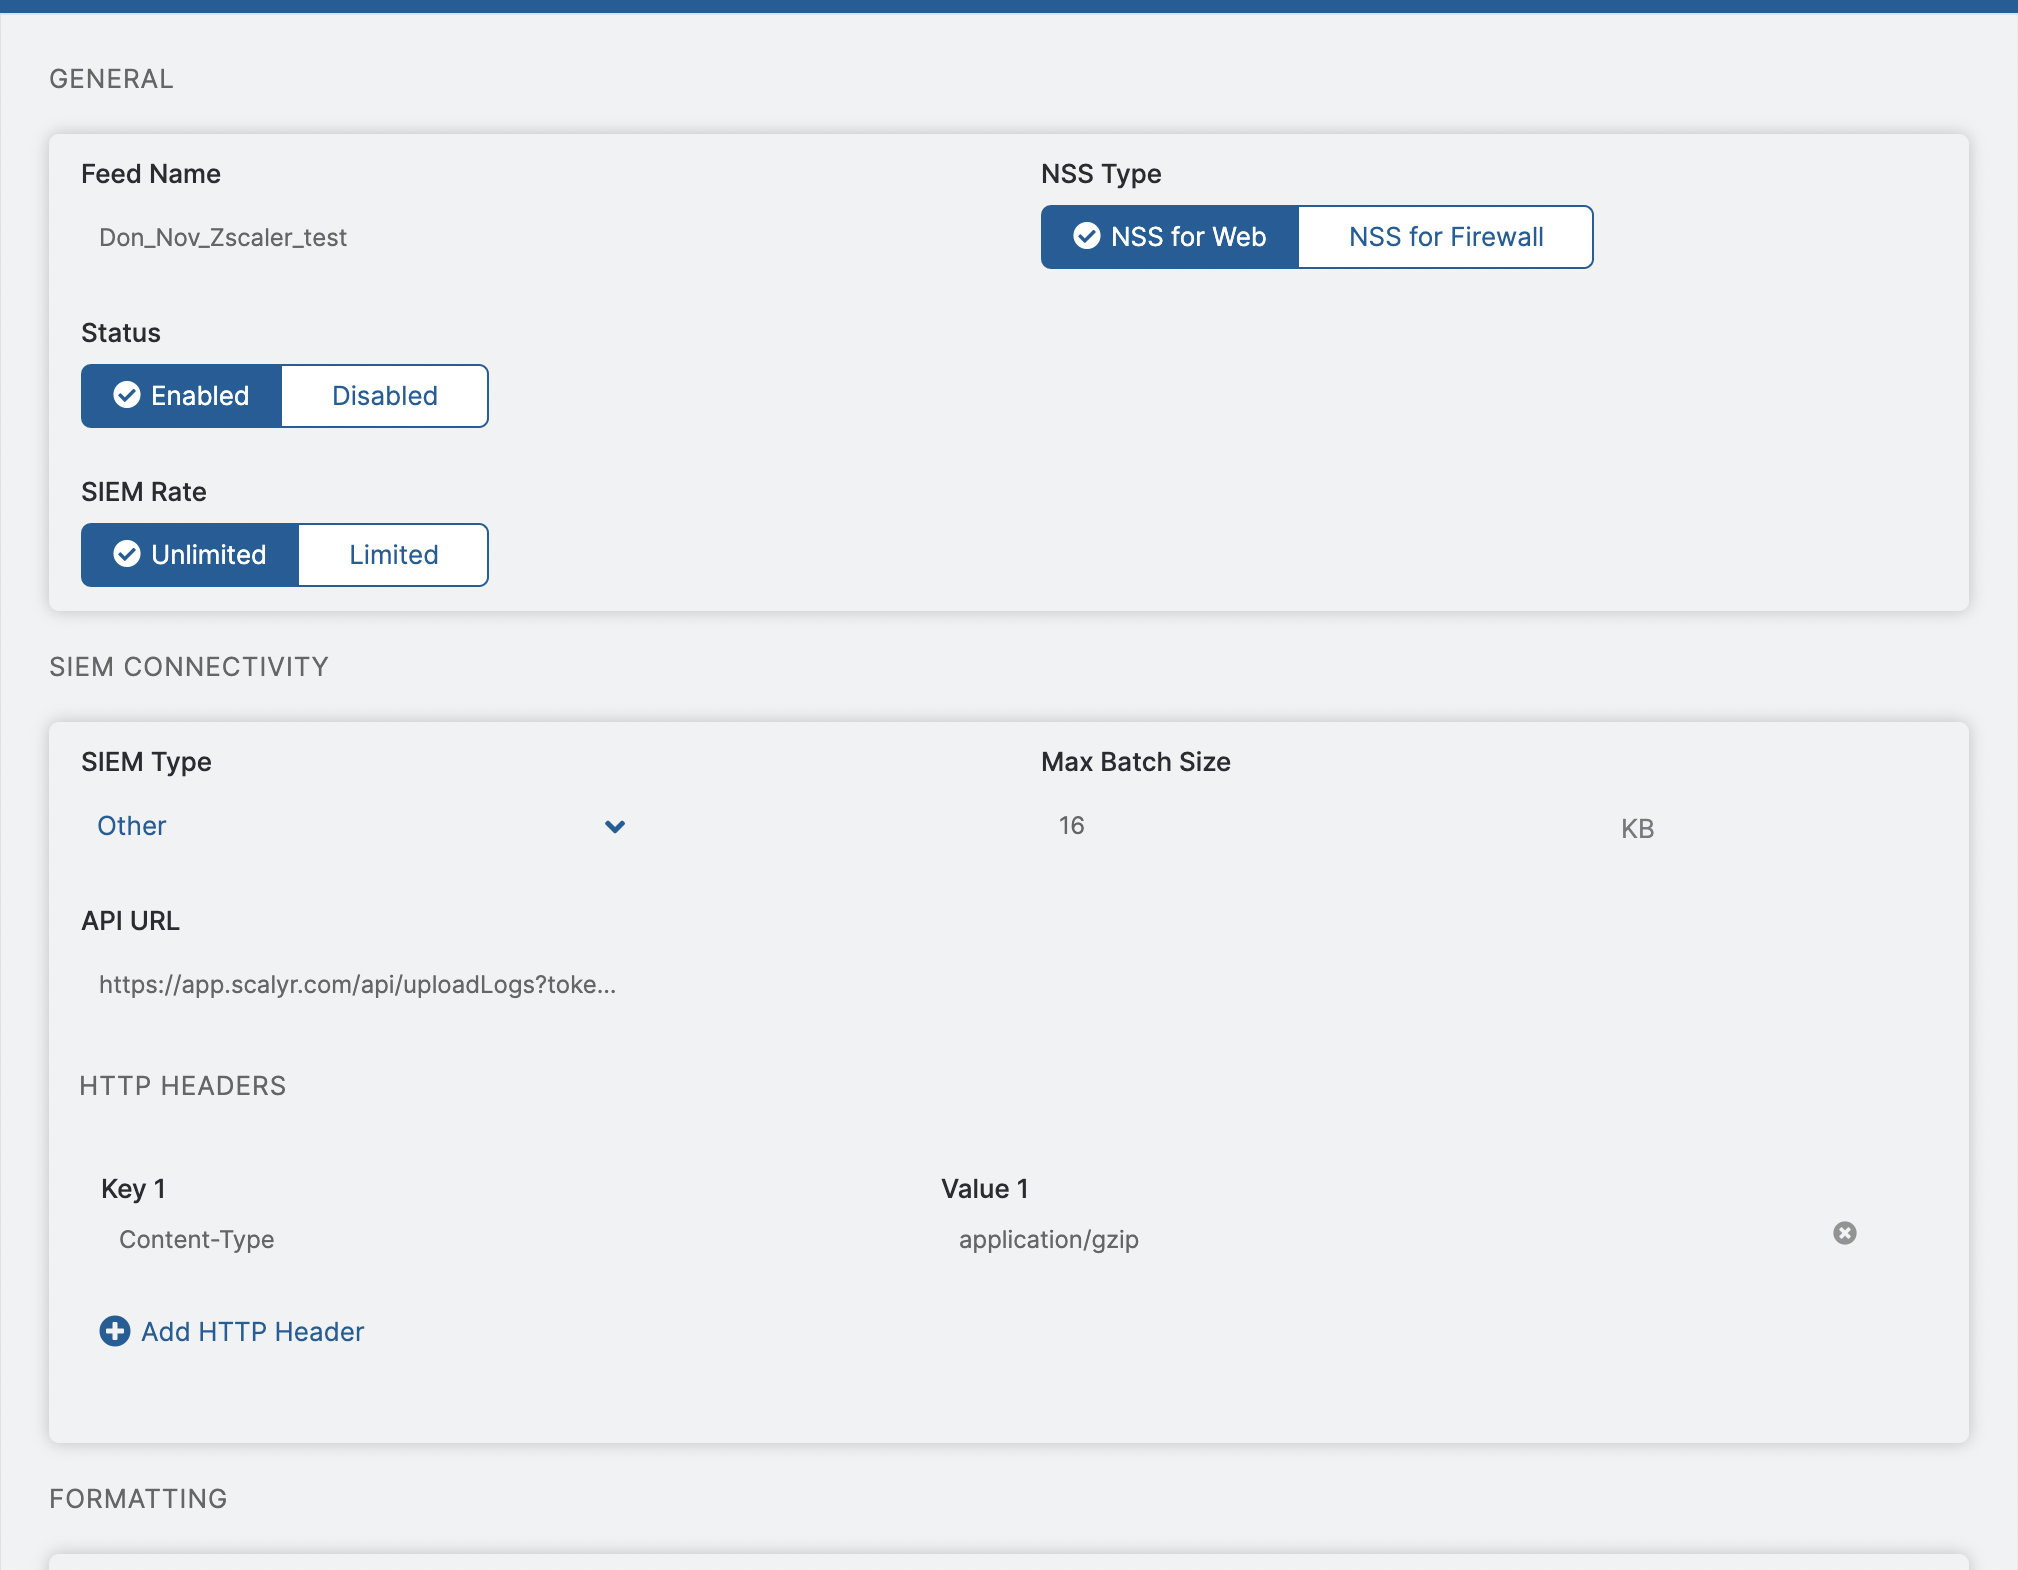
-
- Feed name: {{desired_name}}
- SIEM type: select "Other"
- API URL: https://app.scalyr.com/api/uploadLogs?serverHost={{desired_host_name}}&logfile={{desired_logfile_name}}&parser=zscaler&token={{dataset_write_log_key}}
- Key 1: "Content-Type"
- Value 1: "application/gzip"
- Feed Output Type: JSON
- Log Type: {{desired_log_type}
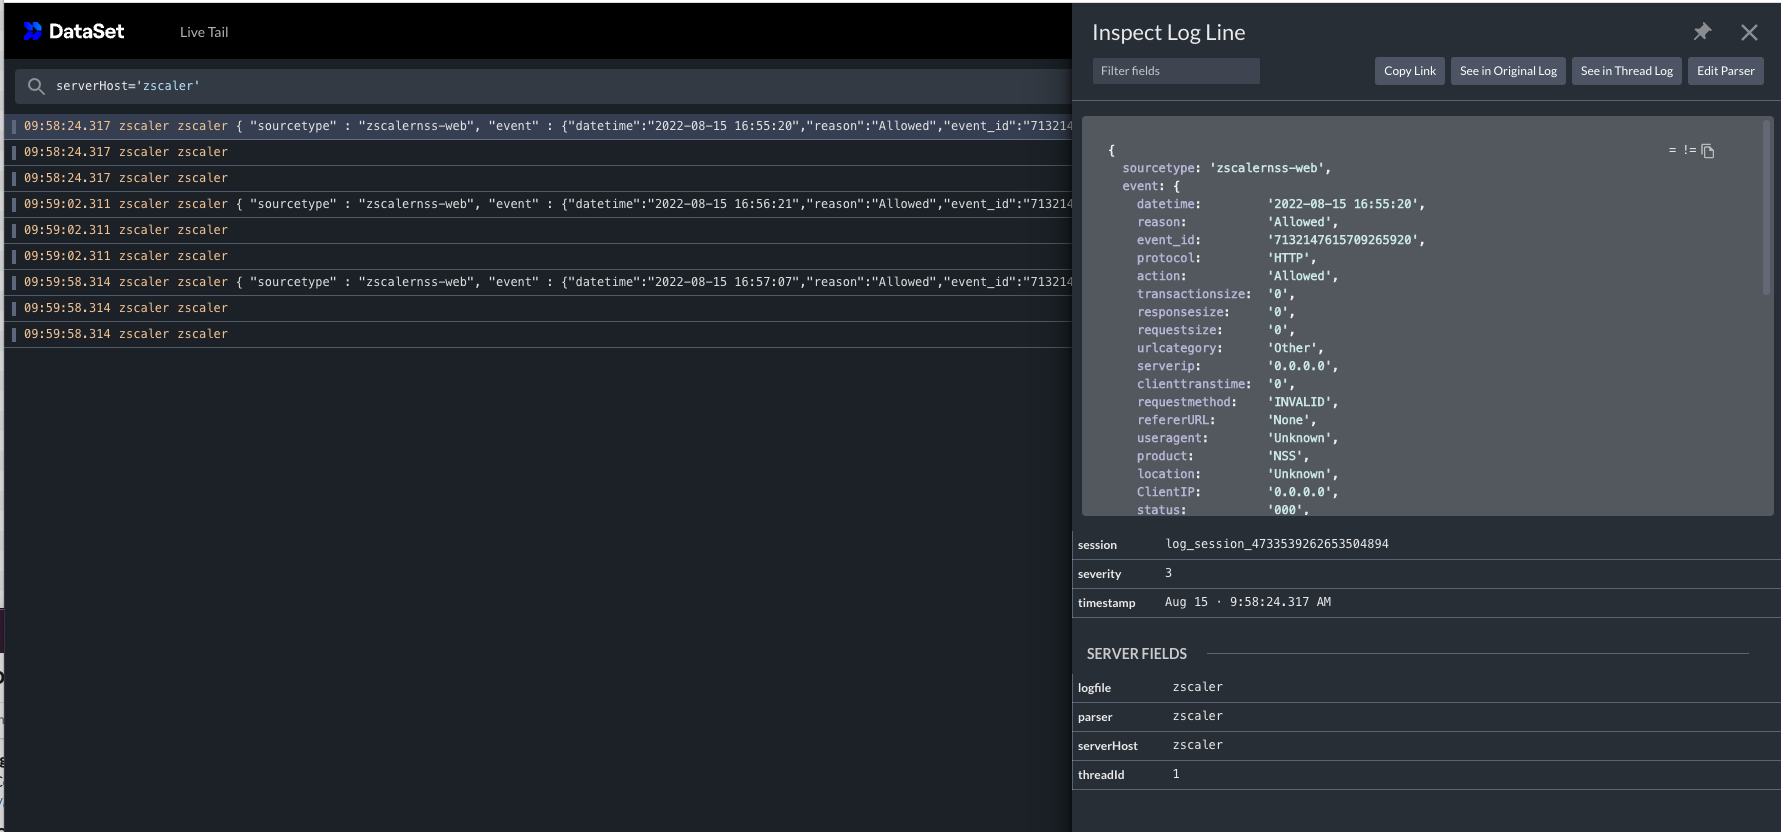
5. You can now send a test HTTP REST API log to your DataSet account by clicking here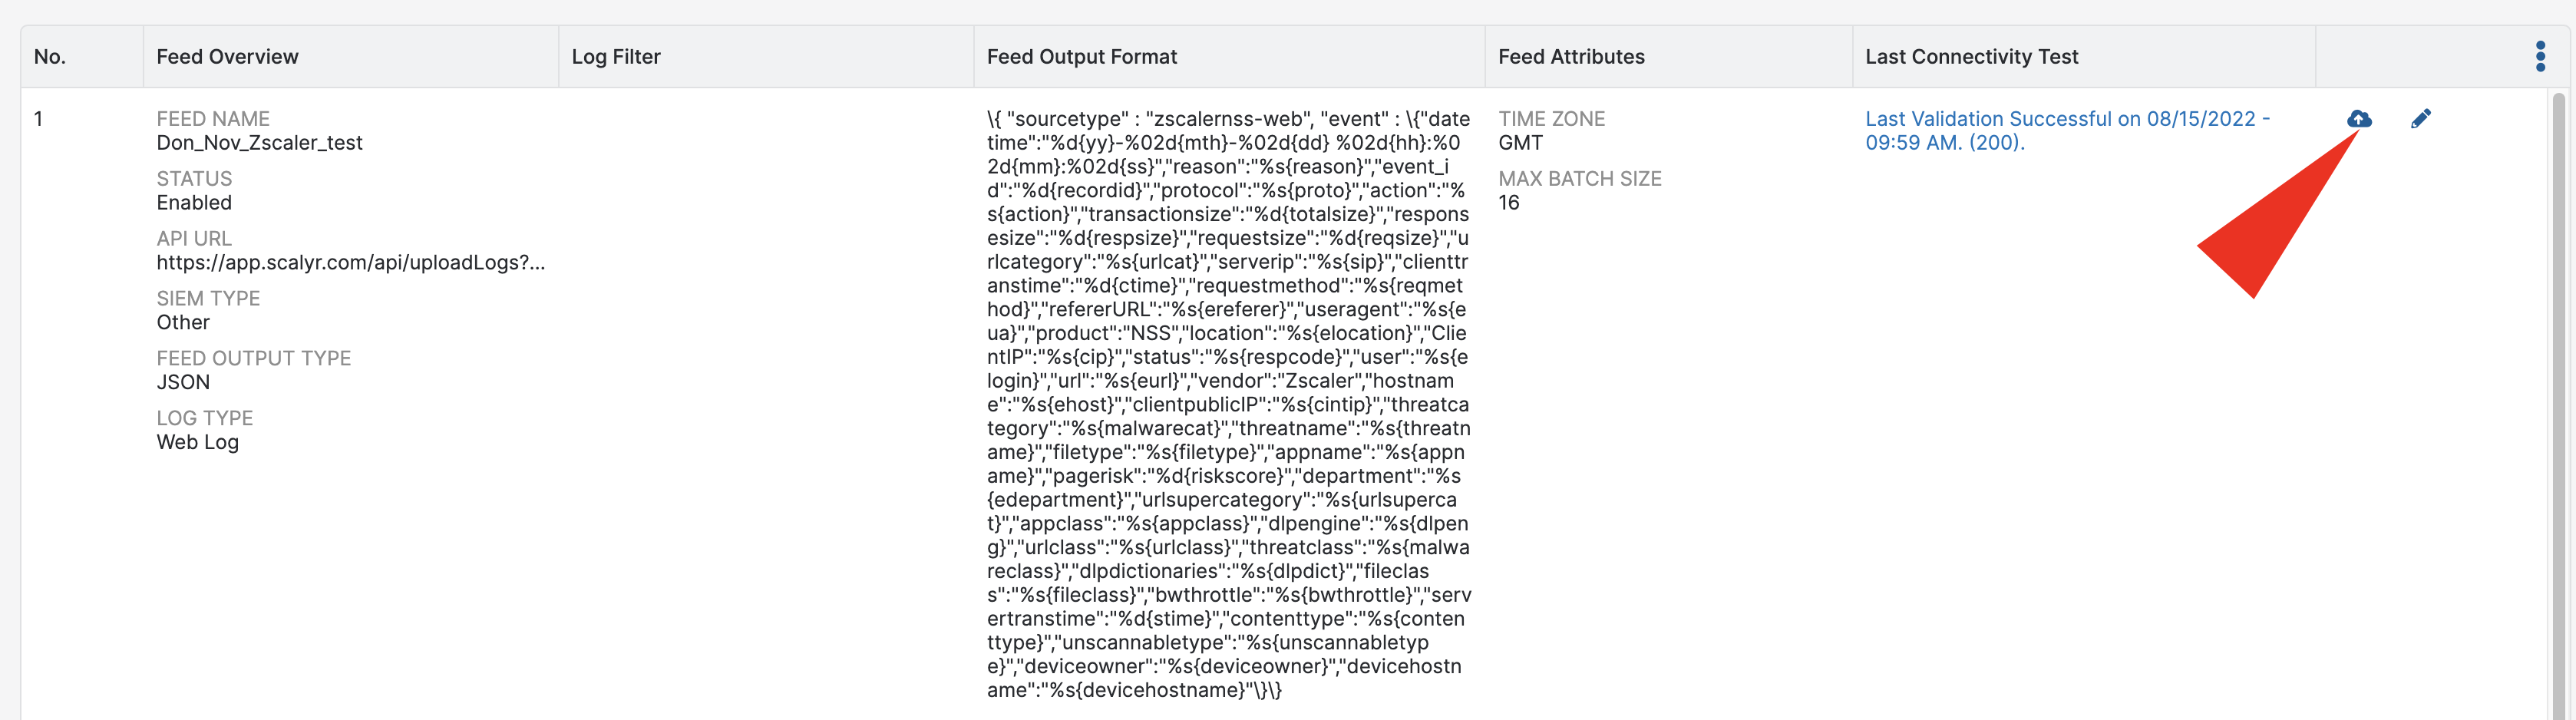
7. From your DataSet account you should receive a Zscaler test message (example below):
6. Setup DataSet (see bottom of page)
Option B: Syslog
- Log in and navigate to Administration > Cloud Configuration > Nano Streaming Service
- Deploy NSS Server (see Zscaler documentation)(guide)
- Add NSS Server (see Zscaler documentation)
- Deploy the DataSet Agent on the NSS Server
- Setup the Dataset syslog monitor
- Point the NSS server to the Agent's syslog monitor
- Setup DataSet (see bottom of page
Setup DataSet
- Create Parser
- Paste the following format definitions:
-
-
{
  // specify a time zone if the timestamps in your log are not in GMT
  // timezone: "GMT-0800"
  formats: [
    {
      format: "^\\s+$$"
      discard: true
    },
    {
      format: "\\{ \"sourcetype\" : \"$sourcetype$\", \"event\" : $=json{parse=dottedJson}$"
      rewrites: [
        {
          input: "datetime",
          output: "timestamp",
          match: ".*",
          replace: "$0"
        },
      ]
    }
  ]
}
-
-
- Create Dashboard
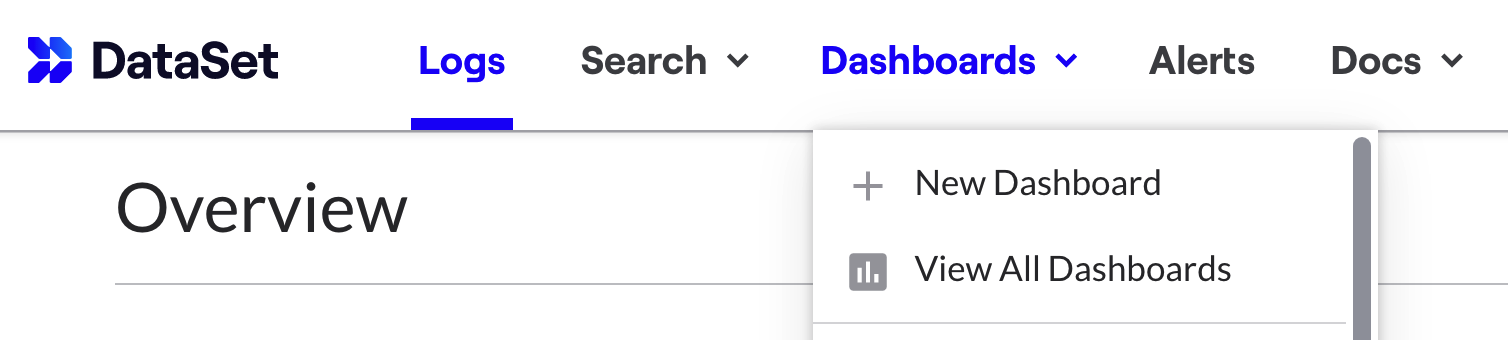
- Paste Dashboard
{
graphs: [
{
graphStyle: "stacked_bar",
layout: {
h: 10,
w: 14,
x: 0,
y: 0
},
plots: [
{
facet: "rate",
filter: "(parser='zscaler')",
label: "Rate"
}
],
title: "Zscaler Event Volume",
yScale: "linear",
lineSmoothing: "straightLines",
barWidth: "auto"
},
{
query: "serverHost contains 'zscaler' requestsize = * responsesize = *\n| group total_requests = sum(requestsize), total_responses = sum(responsesize) by user, appname \n|let total = total_requests + total_responses\n|sort -total",
title: "Zscaler User Volume by App",
layout: {
h: 20,
w: 20,
x: 0,
y: 21
},
graphStyle: ""
},
{
barWidth: "auto",
breakdownFacet: "appclass",
graphStyle: "stacked_bar",
plots: [
{
facet: "responsesize",
filter: "serverHost contains \"zscaler\"",
label: "responsesize"
}
],
title: "Cloud Application Classes (bytes)",
yScale: "linear",
layout: {
h: 11,
w: 15,
x: 14,
y: 10
},
lineSmoothing: "straightLines"
},
{
graphStyle: "pie",
maxPieSlices: 20,
query: "urlcategory = *\n|group count() by urlcategory ",
title: "Top Url Categories",
layout: {
h: 11,
w: 30,
x: 29,
y: 10
}
},
{
barWidth: "5 minutes",
breakdownFacet: "appname",
graphStyle: "stacked_bar",
lineSmoothing: "smoothCurves",
plots: [
{
filter: "urlcategory = * appclass = 'Social Networking' ",
label: "Rate"
}
],
title: "Social Networking Applications",
yScale: "linear",
layout: {
h: 11,
w: 14,
x: 0,
y: 10
}
,
},
{
graphStyle: "donut",
maxPieSlices: 10,
query: "urlclass='Advanced Security Risk'\n|group count() by urlcategory ",
title: "Top Advanced Threats",
layout: {
h: 10,
w: 16,
x: 29,
y: 0
}
},
{
query: "user matches \".*@.*\" responsesize = * \n\n|group \"total_bytes\" = sum(responsesize) by user\n|sort -total_bytes\n",
title: "Top Users",
layout: {
h: 10,
w: 15,
x: 45,
y: 0
}
},
{
barWidth: "5 minutes",
breakdownFacet: "appname",
graphStyle: "stacked_bar",
layout: {
h: 10,
w: 15,
x: 14,
y: 0
},
lineSmoothing: "smoothCurves",
plots: [
{
filter: "urlcategory = * appclass = 'Streaming Media' ",
label: "Rate"
}
],
title: "Streaming Media Applications",
yScale: "linear"
},
{
query: "user = * threatname = * threatname != \"None\" threatcategory != \"None\" \n| group count = count() by threatname, threatcategory, threatclass, user\n| sort - count",
title: "Categorized Threats Detected",
graphStyle: "",
layout: {
h: 9,
i: "8",
minH: 3,
minW: 6,
w: 20,
x: 20,
y: 25
}
},
{
barWidth: "5 minutes",
graphStyle: "stacked",
lineSmoothing: "smoothCurves",
plots: [
{
filter: "sum(requestsize where requestsize = * ) ",
label: "Request"
},
{
filter: "sum(responsesize where responsesize = * ) ",
label: "Response"
}
],
title: "Total Bandwidth Consumption",
yScale: "linear",
layout: {
h: 20,
w: 20,
x: 40,
y: 21
}
},
{
barWidth: "10 minutes",
breakdownFacet: "threatname",
graphStyle: "stacked_bar",
plots: [
{
filter: "appclass = * action = 'Blocked' threatname != 'None'",
label: "Rate"
}
],
title: "Known Threat",
yScale: "linear",
lineSmoothing: "straightLines",
layout: {
h: 11,
w: 20,
x: 20,
y: 30
}
},
{
barWidth: "10 minutes",
breakdownFacet: "appname",
graphStyle: "stacked_bar",
plots: [
{
facet: "rate",
filter: "(logfile contains 'syslog' || k8s-controller contains 'syslog' || k8s-cron-job contains 'syslog' || k8s-daemon-set contains 'syslog' || k8s-deployment contains 'syslog' || k8s-job contains 'syslog' || k8s-replica-set contains 'syslog' || k8s-replication-controller contains 'syslog' || k8s-stateful-set contains 'syslog')",
label: "rate"
}
],
title: "Browsing ",
yScale: "linear",
layout: {
h: 14,
w: 20,
x: 40,
y: 41
}
},
{
graphStyle: "pie",
maxPieSlices: 10,
query: "(logfile contains 'zscaler')\n|columns appname\n|group count = count() by appname\n|sort -count\n|limit 10",
title: "Browsing Stats",
layout: {
h: 14,
w: 20,
x: 0,
y: 41
}
}
]
/* parameters: [
{
defaultValue: "www-data",
facet: "src.process.user",
name: "Username"
}
],*/
options: {"layout":{"locked":1}},
filters: [
{
facet: "user",
name: "Username"
}
]
}
- Paste the following format definitions:
Comments
0 comments
Please sign in to leave a comment.